|

HOME |
ABOUT | INDEX |
NEWS |
FACEBOOK |
CONTACT
STATISTICS
Research | Data | Reports

Reports and Research
News Reports|Current Events
Library Resources|Publications
Magazines|Journals|Periodicals
Science and Technology
Resources

Gallup Poll
Update:
LGBTQ Population Continues to Grow
In 2025, LGBTQ identification remained steady at nine
per cent in the US, according to a survey.
--Data from telephone interviews conducted by Gallup with
more than 13,000 US adults revealed that around nine per
cent of US adults identify within the LGBTQ community.
--The percentage remains unchanged from the year before,
but remains more than double of 2012, the first year
Gallup measured the LGBTQ population.

Attitudes Toward Same-Sex Marriage and Transgender Issues
are Shifting, Poll Shows
With Bisexuals Leading the Charge, US LGBTQ Population Has
Doubled Since 2012
New Poll Shows Support for LGBTQ Rights Continues to Drop
in the US
Worrying Proportion of Americans Still Think Being Gay is
Morally Wrong
Twice as Many LGBTQ People in US Than in 2012, Study Shows
Between 2021 and 2023, Gallup recorded readings of
roughly seven per cent.
--The results followed respondents being asked whether
they identify as heterosexual, lesbian, gay, bisexual,
transgender or something else.
--A majority of 86 per cent said they are heterosexual,
while nine per cent said they identified with one of the
LGBTQ identities. Five per cent gave no response.
--The largest share of LGBTQ adults said they are
bisexual, representing about five per cent of the entire
US adult population.
--Meanwhile, 17 per cent of LGBTQ adults identify as gay,
16 per cent as lesbian and 12 per cent as transgender,
each representing between one and two per cent of all US
adults.
--Since Gallup began measuring LGBTQ identities as
separate categories in 2020, it has found the bisexual
identity to have consistently been the most common, and
even growing.
Attitudes Toward Same-Sex Marriage and Transgender Issues
are Shifting, Poll Shows
With Bisexuals Leading the Charge, US LGBTQ Population Has
Doubled Since 2012
New Poll Shows Support for LGBTQ Rights Continues to Drop
in the US
Worrying Proportion of Americans Still Think Being Gay is
Morally Wrong
Twice as Many LGBTQ People in US Than in 2012, Study Shows
In 2020, just over three per cent of US adults said
they were bisexual, compared with the current number of
just over five per cent.
--But it isn’t just bisexual identities that have
increased – all others have as well.
--The increase in LGBTQ identities has been found to be
driven by higher rates among adults under the age of 30.
Women also have a higher rate of LGBTQ identification,
while Democrats are more likely than Republicans to report
being part of the community.
--Last year, a report by dating app Hinge revealed that
Gen Z are more open-minded than millennials when it comes
to their sexuality.
[Source: Chantelle Billson, Pink News, February 2026]
New Data: More Female Same-Sex Couple Households in US
Than Male
72% of Americans Support LGBTQ Rights and
Protections
National Survey: LGBTQ Youth Mental Health
In the Voices of People Like Me: LGBTQ Coping During
Trump’s Administration
Nearly 1 in 5 LGBTQ Adults Have Never Come Out, Gallup
Survey Finds
Americans Still Support Marriage Equality by a Vast
Majority
Gallup Poll: Twice as Many Americans Now Identify as
LGBTQ
Study Shows Gen Z are More Likely to be
LGBTQ than Republican
Mental Health Concerns in LGBTQ
Community by Race
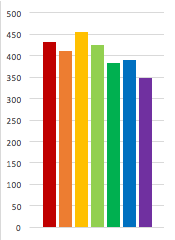
Racial Differences Among
LGBTQ Adults in the US
Research conducted by the
Williams Institute at UCLA School of Law finds high
rates of physical and mental health concerns among
certain populations within the LGBTQ community.
The report discusses LGBTQ well-being at the
intersection of race and shares statistics on LGBTQ
adults reporting poor health and depression in the
White, Latinx, Black, Asian, Pacific Islander, and
Native American communities.

Reporting poor health:
22% White
29% Latinx
24% Black
12% Asian
25% Pacific Islander
30% Native American
Experiencing depression:
37% White
30% Latinx
26% Black
19% Asian
26% Pacific Islander
39% Native American
Racial Differences Among LGBTQ Adults in the US
LGBTQ Identification in US Ticks Up to 7.1%
Attitudes Toward Same-Sex Marriage and Transgender Issues
are Shifting, Poll Shows
With Bisexuals Leading the Charge, US LGBTQ Population Has
Doubled Since 2012
New Poll Shows Support for LGBTQ Rights Continues to Drop
in the US
Worrying Proportion of Americans Still Think Being Gay is
Morally Wrong
Twice as Many LGBTQ People in US Than in 2012, Study Shows
New Poll: Record 7.1% of US Adults Now Identify as LGBTQ
Percentage of LGBTQ Adults in US has Doubled over Past
Decade
HRC Statistics: Growing Up LGBTQ in America
New Poll: 75% of Americans
Support LGBTQ Non-Discrimination Laws
Gallup: More Americans
Than Ever Identify as LGBTQ
CBS News: 1 in 6 Gen Z Adults Identify as Queer
Gallup Poll:
Twice as Many LGBTQ Americans
A February
2022 survey from Gallup shows that, a decade after a
2012 poll showing that 3.5% of Americans identified as
LGBTQ, twice as many Americans now identify as LGBTQ.
Driven largely by Gen Z, the latest poll shows that 7.1%
of America's population now identifies as something
other than heterosexual and/or cisgender.
The change reflects generational comfort levels with
regard to stepping out of the closet. More than 1 in 5,
or 21 percent, of Generation Z adults identify as LGBTQ,
Gallup found. That's almost double the proportion of
millennials, who are 26 to 41, at 10.5 percent, and
nearly five times the proportion of Generation X, who
are 42 to 57, at 4.2 percent.

LGBTQ Population in US Grows by Over 2 Million
7.6% of Adults in the US Now Identify as LGBTQ According
to Poll
ABS Releases First Ever Estimates of
Stats for LGBTQ Australians
LGBTQ Adult Population in United States Reaches 20
Million
Census Bureau Wants LGBTQ Americans to Be Counted
Global Survey: 1 in 5 Young Adults Are Not Straight
LGBTQ People in the US: Select Findings from the
Generations and TransPop Studies
New Poll: Americans Identifying as LGBTQ More Than Ever
Almost 50% of Gen Z Identifies as Not Fully Straight
Equaldex: LGBTQ Rights Across the World
Less than 3 percent of baby boomers, who are 58 to 76,
identify as LGBTQ, compared to just 0.8 percent of
traditionalists, who are 77 or older. Not only is the
trend increasing with each generational cohort — it's
also accelerating, at least within the ranks of
Millennials and, especially, Gen Z Americans. The
percentage of Generation Z adults who are queer has
almost doubled since 2017 — jumping from 10.5 percent in
2017 to 20.8 percent. The rise shows that younger Gen
Zers, who have turned 18 since 2017, are more likely
than older Gen Zers to identify as queer.
The poll also suggested that bisexual people constitute
the largest single subset of the LGBTQ rainbow. Here,
too, Gen Z led the way, with a whopping 15% of
respondents from that age group saying they were bi.
But the cultural landscape is not monolithic. While 70
percent of Americans support same-sex marriage rights,
and a majority also support nondiscrimination
protections for LGBTQ people, a "Values and Beliefs"
survey from 2021 saw a noticeable decline in acceptance
for trans people serving openly in the Armed Forces as
compared to a poll from only two years earlier.
Trans athletes, the target of an ongoing and
record-shattering rash of hostile legislation, were also
a notable subject in that 62 percent of Americans say
trans athletes should only be allowed to play on sports
teams that correspond with the sex they were assigned at
birth, according to last year's poll.
[Source:
NBC News, February 2022]
New Data: More Female Same-Sex Couple Households in US
Than Male
72% of Americans Support LGBTQ Rights and
Protections
National Survey: LGBTQ Youth Mental Health
In the Voices of People Like Me: LGBTQ Coping During
Trump’s Administration
Nearly 1 in 5 LGBTQ Adults Have Never Come Out, Gallup
Survey Finds
Americans Still Support Marriage Equality by a Vast
Majority
Gallup Poll: Twice as Many Americans Now Identify as
LGBTQ
Study Shows Gen Z are More Likely to be
LGBTQ than Republican
LGBTQ Identification in US Ticks Up to 7.1%
New Poll: Record 7.1% of US Adults Now Identify as LGBTQ
Percentage of LGBTQ Adults in US has Doubled over Past
Decade
HRC Statistics: Growing Up LGBTQ in America
New Poll: 75% of Americans
Support LGBTQ Non-Discrimination Laws
Gallup: More Americans
Than Ever Identify as LGBTQ
CBS News: 1 in 6 Gen Z Adults Identify as Queer
More Than 20 Million Americans
Identify as LGBTQ, According to Report
At least 20 million people in the US identify as LGBTQ,
according to a report released in Dec 2021 from the
Human Rights Campaign Foundation.
The group's report — “We Are Here: Understanding the
Size of the LGBTQ Community” — found that 8 percent of
respondents of the US Census Bureau’s Household Pulse
Survey reported that they identify as “LGBTQ,” and an
additional 2 percent said their sexual orientation was
not gay, lesbian, bisexual, or straight. That number
could include those who identify as pansexual, asexual,
or as something else.
That survey also suggests that about 2 million people in
the country identify as trans, which HRC noted is higher
than previous estimates. Out of those identifying as
LGBTQ, bisexual people represented the majority with
about 4 percent of respondents.
LGBTQ Population in US Grows by Over 2 Million
1 in 5 Adult Members of Gen Z
Self-Identify as LGBTQ
America's LGBTQ Community: Eye-Opening Facts and Stats
Attitudes Toward Same-Sex Marriage and Transgender Issues
are Shifting, Poll Shows
With Bisexuals Leading the Charge, US LGBTQ Population Has
Doubled Since 2012
New Poll Shows Support for LGBTQ Rights Continues to Drop
in the US
Worrying Proportion of Americans Still Think Being Gay is
Morally Wrong
Twice as Many LGBTQ People in US Than in 2012, Study Shows
Wikipedia: LGBTQ Demographics
in the US
Daily Beast: Just How Many LGBTQ
Americans Are There?
Almost 50% of Gen Z Identifies as Not Fully Straight
“LGBTQ people are here — in every town, in every city,
in each and every ZIP code. This data shows what we’ve
suspected: Our community is larger and more widespread
than we could have known up to this point, ” said Human
Rights Campaign Interim President Joni Madison in a
press release. “We’re proud to bring this data to light
and set the stage for a future where all the millions of
LGBTQ people in America enjoy full legal and lived
equality.”
Madison added: “I commend the Biden administration and
the US Census Bureau for finally allowing researchers to
count us and look forward to seeing the LGBTQ community
counted in further studies.”
California and Texas had the largest number of LGBTQ
residents with 2.6 million and 1.7 million respectively.
The study found that states less populated than those
two tended to have a higher percentage of their
population identify as LGBTQ.
Previous attempts to document the size of the LGBTQ
population in the US have proven difficult. There have
been issues in sampling as well as bias that affect
respondents’ answers. Prior to the HRC report, the
Public Religious Research Institute’s American Values
Atlas found 4.4 percent of Americans identified as
LGBTQ. The HRC findings double that number and still may
have undercounted the community, according to
researchers.
The Census Bureau’s largest surveys do not ask questions
about sexual orientation or gender identity. However,
data from these surveys help decide where billions of
dollars of federal money will go each year. Lacking
those questions means money is not going to programs and
initiatives supporting LGBTQ people.
[Source: Alex Cooper, Advocate Magazine, December 2021]
New Data: More Female Same-Sex Couple Households in US
Than Male
72% of Americans Support LGBTQ Rights and
Protections
National Survey: LGBTQ Youth Mental Health
In the Voices of People Like Me: LGBTQ Coping During
Trump’s Administration
Americans Still Support Marriage Equality by a Vast
Majority
Study Shows Gen Z are More Likely to be
LGBTQ than Republican
Poll Shows Gen Z Adopting Their Own Labels for Sexuality
LGBTQ Adult Population in United States Reaches 20
Million
ABS Releases First Ever Estimates of
Stats for LGBTQ Australians
New Poll: Americans Identifying as LGBTQ More Than Ever
NBC: 1 in 5 Adult Members of Gen Z
Self-Identify as LGBTQ
States With the Smallest Percentage of
LGBTQ People
Equaldex: LGBTQ Rights Across the World
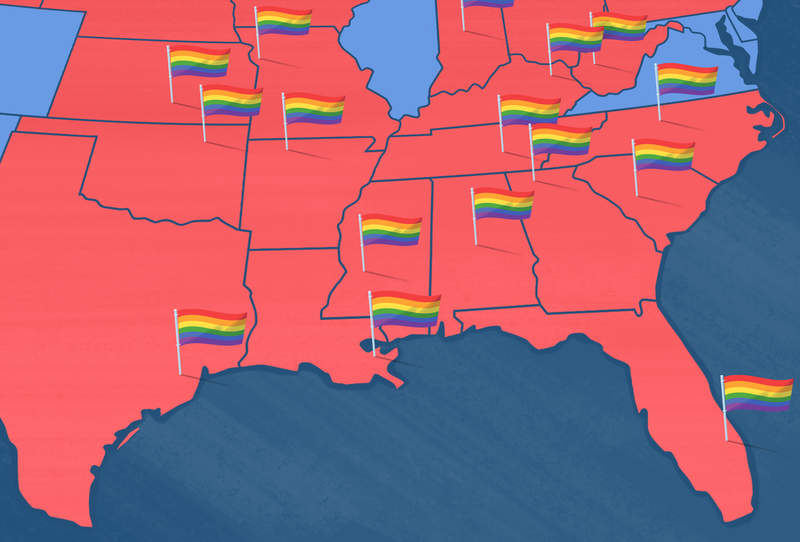
LGBTQ
Population in
the US
Which
State Is the Queerest? What States Have the Most LGBTQ
People?
The
Williams Institute at the University of California, Los
Angeles, has released a report on the adult LGBTQ
population of the United States, revealing some
unexpected information about the queer hubs of modern
America.
Overall, 14.1 million people in the US reported that
they "identify as LGBTQ" between 2020 and 2021, making
up a significant portion of the population at 5.6
percent. But not everyone is living in New York or
California — in fact, neither cracked the top ten of
states with the most LGBTQ people, relative to
population.
Going by population alone, California is the state with
the most LGBTQ people (1,549,600). That makes sense,
seeing as California has the largest overall population
of any state. However, California's LGBTQ people make up
a relatively small portion of the state's total
population (just 5.1 percent).
When looking at population by proportion, several states
surprised us with how large their LGBTQ demographic is.
Washington DC technically has the highest percentage of
LGBTQ people, with 81,400 making up 14.3 percent of the
capital's population (But, our list only includes actual
"states").
Here are
the states with the most LGBTQ people,
percentage-wise....
10. Ohio - 557,600 LGBTQ residents / 6.2 percent of
population
9. Minnesota (Tie) - 267,600 LGBTQ residents
/ 6.3 percent of population
9. Tennessee (Tie) - 328,900 LGBTQ residents
/ 6.3 percent of population
8. Rhode Island (Tie) - 54,800 LGBTQ
residents / 6.5 percent of population
8. Maine (Tie) - 69,900 LGBTQ residents /
6.5 percent of population
8. Massachusetts (Tie) - 356,200 LGBTQ
residents / 6.5 percent of population
7. Nevada - 150,100 LGBTQ residents / 6.6
percent of population
6. Colorado - 294,500 LGBTQ residents / 6.8
percent of population
5. Washington - 398,700 LGBTQ residents /
6.9 percent of population
4. New Hampshire - 78,400 LGBTQ residents /
7.2 percent of population
3. Vermont - 37,600 LGBTQ residents / 7.4
percent of population
2. Delaware - 56,600 LGBTQ residents / 7.5
percent of population
1. Oregon - 253,300 LGBTQ residents / 7.8
percent of population
And here
are the states with the least LGBTQ people,
percentage-wise...
5. South Carolina (Tie) - 192,800 LGBTQ residents / 4.9
percent of population
5. North Dakota ( Tie ) - 28,400 LGBTQ residents / 4.9
percent of population
4. Iowa - 113,600 LGBTQ residents / 4.7 percent of
population
3. Alabama - 173,000 LGBTQ residents / 4.6 percent of
population
2. North Carolina - 353,100 people LGBTQ residents / 4.4
percent of population
1. Mississippi (Tie) - 93,300 LGBTQ residents / 4.1
percent of population
1. West Virginia (Tie) - 60,000 LGBTQ residents / 4.1
percent of population
[Source: Ryan Adamczeski, Advocate, Dec 2023]
Nearly 1 in 5 LGBTQ Adults Have Never Come Out, Gallup
Survey Finds
LGBTQ Population in US Grows by Over 2 Million
More Than 20 Million Americans Identify as LGBTQ,
According to Report
Gallup Poll: Percentage of LGBTQ Population Rises in US
NBC News: New Poll Says Americans Identifying as LGBTQ
More Than Ever
USA Today: Young People Driving Numbers as LGBTQ
Percentage Increases
ABC News: Increase in Percentage of Americans
Identifying as LGBTQ
CBS News: 1 in 6 Gen Z Adults Identify as Queer
States With the Smallest Percentage of
LGBTQ People
Almost 50% of Gen Z Identifies as Not Fully Straight
Gallup Poll Shows Growing LGBTQ Population
In February 2021, Gallup released a new poll that showed
a growing percentage of adults in the US are LGBTQ
identifying. In response, Human Rights Campaign
President Alphonso David released the following
statement:
“This poll confirms what we have long known—that the
LGBTQ community is powerful and a growing force in the
United States, and around the world. Young adults, in
particular, feel empowered to publicly claim their
identities—a compelling finding and validation for the
past generations of LGBTQ advocates who have long fought
for full equality. As a growing percentage of the
population comes out as LGBTQ, it only amplifies the
need for the Equality Act to be passed through Congress
swiftly and with bipartisan support in order to secure
consistent and explicit anti-discrimination protections
for LGBTQ people across all areas of life.”
Gallup Poll: Percentage of LGBTQ Population Rises
in US
NBC News: New Poll Says Americans Identifying as LGBTQ More Than Ever
USA Today: Young People Driving Numbers as LGBTQ
Percentage Increases
ABC News: Increase in Percentage of Americans
Identifying as LGBTQ
CBS News: 1 in 6 Gen Z Adults Identify as Queer
Key Points from the poll: Results from a 2020 Gallup
poll were released that showed the estimate of LGBTQ
identifying American adults has risen by more than one
percentage point from the previous 2017 update.
--5.6% of US adults
identify as LGBTQ. The current estimate is up from 4.5%
in Gallup's previous update based on 2017 data.
--More than half of LGBTQ individuals (54.6%) identify
as bisexual.
--One in six adults in Generation Z identify as LGBTQ,
more than any previous generation.
--Women are more likely than men to identify as LGBTQ
(6.4% vs. 4.9%, respectively).
--Americans have grown increasingly supportive of equal
rights for the LGBTQ community and a growing percentage
of Americans identify themselves as LGBTQ—signaling that
public acceptance is critical for LGBTQ individuals to
feel safe identifying as their true selves.
National Survey: LGBTQ Youth Mental Health
In the Voices of People Like Me: LGBTQ Coping During
Trump’s Administration
Americans Still Support Marriage Equality by a Vast
Majority
Nearly 30% of Gen Z Adults Identify as
LGBTQ, National Survey Finds
Study Shows Gen Z are More Likely to be
LGBTQ than Republican
Under Fire: War on LGBTQ People in
America
ABS Releases First Ever Estimates of
Stats for LGBTQ Australians
Most Americans Say Religion Is No Excuse for Anti-LGBTQ
Discrimination
New Poll Finds America Polarized Over Culture, Race and
Woke
Gallop Poll: US LGBTQ Identification Steady at 7.2%
The Number of LGBTQ Americans Has Doubled
Over the Past Decade
Same-Sex Households in the US Surpass 1
Million for the First Time
Survey: 5 Percent of Young Adults Identify as Trans or
Nonbinary
Percentage of LGBTQ Adults in US has Doubled over Past
Decade
Recent Survey of LGBTQ Tolerance
The young are regarded as the most tolerant generation.
That's why results of this LGBTQ survey are "alarming."
Young people are growing less tolerant of LGBTQ
individuals, a jarring turn for a generation
traditionally considered embracing and open, a recent
survey shows. The number of Americans 18 to 34 who are
comfortable interacting with LGBTQ people slipped from
53% in 2017 to 45% in 2018 – the only age group to show
a decline, according to the annual Accelerating
Acceptance report. And that is down from 63% in 2016.
Driving the dilution of acceptance are young women whose
overall comfort levels plunged from 64% in 2017 to 52%
in 2018, says the survey conducted by The Harris Poll on
behalf of LGBTQ advocacy group GLAAD.
“We count on the narrative that young people are more
progressive and tolerant,” John Gerzema, CEO of The
Harris Poll, told USA Today. “These numbers are very
alarming and signal a looming social crisis in
discrimination.”


New Data: More Female Same-Sex Couple Households in US
Than Male
LGBTQ Population in the US Grows
by Over 2 Million
Poll Shows Gen Z Adopting Their
Own Labels for Sexuality
Worryingly High
Number of Trans Adults Have
Considered Suicide
PBS: LGBTQ
America By The Numbers
Kids with Lesbian Parents Are Just as
Healthy As Other Kids, Study Finds
Census Estimate: One Million LGBTQ Households in America
CDC: LGBTQ Health Statistics
Pew Research Center: Survey of LGBTQ Americans
Info: LGBTQ Research and Reports
States With the Smallest Percentage of
LGBTQ People
Among the findings:
--36% of young people said they were uncomfortable
learning a family member was LGBTQ, compared with 29% in
2017
--34% were uncomfortable learning their doctor was LGBTQ
vs. 27% a year earlier
--39% were uncomfortable learning their child had a
school lesson on LGBTQ history vs. 30% in 2017
The negative shift for the young is surprising, said
Sarah Kate Ellis, GLAAD president and CEO. When GLAAD
delved into the numbers, the group found that the
younger generation was coming in contact with more LBGTQ
people, particularly individuals who are non-binary and
don’t identify simply as lesbian or gay. “This newness
they are experiencing could be leading to this erosion.
It’s a newness that takes time for people to understand.
Our job is to educate about non-conformity,” she said.
The survey results come during Pride 2019 and on the eve
of the 50th anniversary of the Stonewall riots, which
sparked the LGBTQ rights movement. They also land at a
dark hour politically and culturally for the LGBTQ
community amid a rise in inflammatory rhetoric and
dozens of policy setbacks, such as a ban on transgender
people in the military and religious exemption laws that
can lead to discrimination, Ellis and Gerzema said. Both
are a likely force behind the young's pushback on
tolerance, they said.
Nearly 1 in 5 LGBTQ Adults Have Never Come Out, Gallup
Survey Finds
Almost 50% of Gen Z Identifies as Not Fully Straight
USA Today: LGBTQ Tolerance Survey by GLAAD
Graph: GLAAD Tolerance Survey
Center for American Progress: Widespread
LGBTQ Discrimination
USA Today: Review of LGBTQ Equality Over
the Past Decade
Battles the LGBTQ Community is Still
Fighting
Human Rights Watch: Anti-LGBTQ Laws
Around the World
Equaldex: LGBTQ Rights Across the World
A new survey out during Pride 2019 shows young people
have grown less accepting of LGBTQ individuals. The
young are bombarded by hate speech on social platforms
from viral videos to “mean tweets,” Gerzema said. “Our
toxic culture is enveloping young people. It instills
fear, alienation, but also permissibility” that could
sway “impressionable" young minds on what is acceptable.
And there is a more menacing side, Ellis said. “We are
seeing a stark increase in violence in the community.”
GLAAD has documented more than 40 incidents of LGBTQ
hate violence since January 1.
Two recent high-profile incidents: In June 2019, a young
gay couple were assaulted outside a popular strip of
bars in Washington, DC, in what police are investigating
as a hate crime. A few weeks earlier, a Detroit man was
charged in a triple homicide in which two gay men and
one transgender woman were deliberately targeted, police
say. The FBI released statistics in November showing a
17% increase in overall hate crimes in 2017. Of 7,175
reported crimes, more than 1,200 were based on sexual
orientation or gender identity bias.
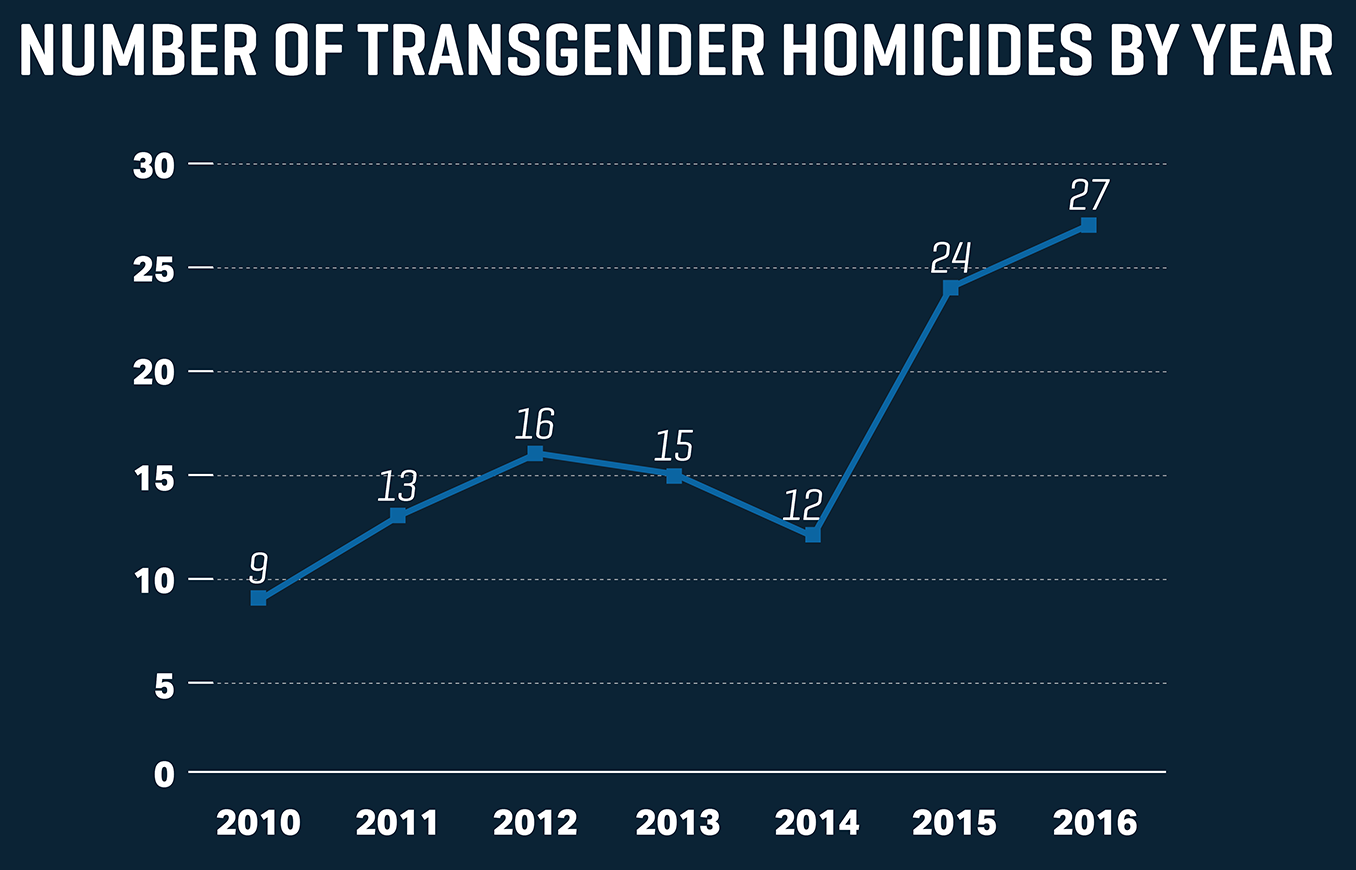
The transgender community has been especially hard hit.
In 2018, there were at least 26 deaths of transgender
individuals in the US because of violence, mostly
black transgender women, according to the Human Rights
Campaign, which has tracked 10 deaths so far this year.
The situation is so grim that the American Medical
Association warned of “an epidemic of violence”
against transgender people, particularly those of color.


Americans Still Support Marriage Equality by a Vast
Majority
More Than 20 Million Americans Identify as LGBTQ,
According to Report
Gallup Poll: Percentage of LGBTQ Population Rises in US
NBC News: New Poll Says Americans Identifying as LGBTQ
More Than Ever
USA Today: Young People Driving Numbers as LGBTQ
Percentage Increases
ABC News: Increase in Percentage of Americans
Identifying as LGBTQ
CBS News: 1 in 6 Gen Z Adults Identify as Queer
The increase in violence and discrimination mirrors the
trajectory of the acceptance survey. The report, first
commissioned in 2014, reflected positive momentum from
historic gains for LGBTQ rights (such as the same-sex
marriage ruling) in its first three years. But that
shifted in 2017 with fallout from the presidential
election, advocates say.
Still, there is cause for optimism this year, Ellis
said. Nearly half of all non-LGBTQ adults, or 49%, are
classified in the survey as “allies” with high levels of
tolerance. That is the same number as 2017, and “that is
a big deal,” she said. Support for equal rights is also
stable, with eight out of 10 backing equality for LGBTQ
people for the third consecutive year.
Ellis is confident the younger generation can rise again
as beacons of unbiased values. When numbers dipped a
year ago for young males, GLAAD went to where male
audiences consume content: video games. The advocacy
group worked with the industry to introduce diverse
characters and help shape attitudes. The group has
similar outreach plans for targeting young women in a
popular female venue, country music concerts, she said.
It’s crucial LGBTQ advocates stay vigilant, Gerzema
said. “In this toxic age, tolerance (even among youths)
now seems to be parsed out. Nothing today should be
taken for granted.”
[Source:
Susan Miller, USA Today, June 2019]
USA Today: LGBTQ Tolerance Survey by GLAAD
Graph: GLAAD Tolerance Survey
Almost 50% of Gen Z Identifies as Not Fully Straight
Center for American Progress: Widespread
LGBTQ Discrimination
USA Today: Review of LGBTQ Equality Over
the Past Decade
Battles the LGBTQ Community is Still
Fighting
Human Rights Watch: Anti-LGBTQ Laws
Around the World
LGBTQ Workplace
Statistics
It Is Difficult to Determine the Size of the LGBTQ
Population. Stigma and methodological barriers make it
difficult to get an accurate count of the Lesbian, Gay,
Bisexual, Transgender and Queer population. The
following statistics are the best estimates from surveys
around the world.
Individuals...
--In Canada, 1.7% of Canadians between the ages of 18
and 59 are gay or lesbian, and an additional 1.3% are
bisexual.
--In Japan, 8.9% of the population between the ages of
20 and 59 is LGBTQ.
--In the United Kingdom, 2.0% are LGBTQ.
--In the United States, 4.5% are LGBTQ.
Couples...
--In Australia, 0.9% of all couples are same-sex
couples.
--In Canada, 0.9% of all couples are same-sex couples.
--In Germany, 0.5% of all couples are same-sex couples.
--In the United States, 1.5% of all couple-households
are same-sex couple-households.
India’s
Supreme Court struck down section 377 of India’s penal
code, a colonial-era law that penalized consensual
same-sex relations, in September 2018.

LGBTQ Workplace Statistics: Catalyst Research
Center for American Progress: Widespread
LGBTQ Discrimination
USA Today: Review of LGBTQ Equality Over
the Past Decade
Battles the LGBTQ Community is Still
Fighting
Human Rights Watch: Anti-LGBTQ Laws
Around the World
In the Workplace...
Most Countries and States Do Not Provide Legal
Protections for LGBTQ Employees... Seventy-four
countries prohibit discrimination in employment because
of sexual orientation, including Australia, Canada,
France, Germany, Mexico, the Netherlands, Switzerland,
and the United Kingdom.
--There is no federal law protecting employees from
discrimination based on sexual orientation or gender
identity in the United States.
--There is no state-level protection for sexual
orientation or gender identity in 29 of the 50 US
states. This means employees can be fired for being
LGBTQ.
--In June 2017, the Canadian government amended the
Human Rights Act to outlaw employment discrimination
based on gender identity and expression.
Today, More Fortune 500 Companies Offer Benefits to
Their LGBTQ Employees... As of 2018, 93% of Fortune 500
companies have non-discrimination policies that include
sexual orientation. Eighty-five percent have
non-discrimination policies that include gender
identity. Many companies also provide other benefits:
--49% include domestic partner benefits.
--62% include transgender-inclusive benefits.
LGBTQ
Employees Often Face Hostility in the Workplace...
One-fifth (20%) of LGBTQ Americans have experienced
discrimination based on sexual orientation or gender
identity when applying for jobs.
--LGBTQ people of color (32%) are more likely to
experience this type of discrimination than white LGBTQ
people (13%).
--22% of LGBTQ Americans have not been paid equally or
promoted at the same rate as their peers.
Transgender workers are especially vulnerable to
discrimination. In 2015, over a quarter (27%) of the
transgender population said they were not hired, were
fired, or were not promoted due to their gender identity
or expression. 80% of the transgender population who
were employed experienced harassment or mistreatment on
the job or took steps to avoid it. Offensive jokes based
on sexual orientation or gender identity are a form of
harassment.
Over half (53%) of LGBTQ employees heard lesbian and gay
jokes at work, while 37% heard bisexual jokes and 41%
heard transgender jokes in 2018.
Fear
Prevents LGBTQ Employees From Bringing Their Full Selves
to Work... Almost half (46%) of LGBTQ workers in the
United States are closeted in the workplace. Nearly two
thirds (59%) of non-LGBTQ employees believe it is
“unprofessional” to discuss sexual orientation or gender
identity in the workplace.
LGBTQ people often cover or downplay aspects of their
authentic selves (by hiding personal relationships or
changing the way they dress or speak) in order to avoid
discrimination. Employees report feeling exhausted from
spending time and energy concealing their sexual
orientation (17%) and gender identity (13%).
Inclusive Work Cultures Determine Whether LGBTQ
Employees Leave or Stay... A quarter (25%) of LGBTQ
employees report staying in a job due to a LGBTQ-inclusive
work environment. 10% of LGBTQ employees have left a job
because the work environment did not accept LGBTQ
people.
Openly LGBT Corporate Leaders Are Rare... Fewer than 20
board directors in Fortune 500 companies were openly
LGBTQ in 2018. In 2018, Beth Ford became the CEO of Land
O’Lakes and the first openly gay woman to run a Fortune
500 company.
[Source:
Catalyst, LGBTQ Research, June 2019]
LGBTQ Workplace Statistics: Catalyst Research
Center for American Progress: Widespread
LGBTQ Discrimination
USA Today: Review of LGBTQ Equality Over
the Past Decade
Battles the LGBTQ Community is Still
Fighting
Human Rights Watch: Anti-LGBTQ Laws
Around the World
FBI Data:
Anti-LGBTQ Hate Crimes On the Rise
Hate crime
murders in the US reached a 27-year high last year,
according to new data released by the Federal Bureau of
Investigation (FBI), and hate crimes targeting LGBTQ
people rose by 6% in 2018 over 2017.
The 24 hate crime murders that occurred in 2018 mark
their highest occurrence since the FBI began tracking
and reporting hate crimes in 1991. While the number of
overall hate crimes dropped slightly from 7,175 in 2017
to 7,036 in 2018, they remain high. Even more troubling:
the number of actual hate crimes and murders that
occurred in the US is likely to be much higher, due to
under-reporting.
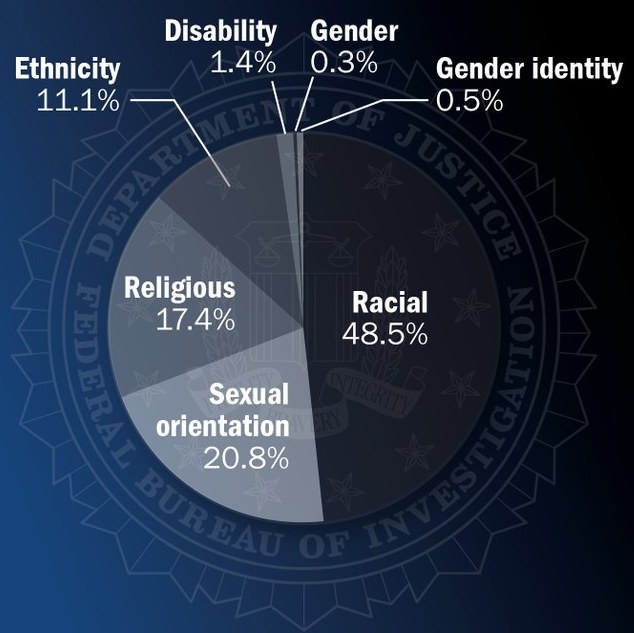
Among the
7,036 “single-bias hate crimes” reported in 2018 (that
is, hate crimes in which a single perceived
characteristic motivated the attacker) 16.7% happened
due to sexual orientation bias and 2.2% occurred due to
gender identity bias. An additional 59.6% occurred due
to racism and 18.7% were motivated by religious-bias.
These 7,036 single-biased hate crimes affected 8,646
victims total.
Of the 1,445 victims targeted due to sexual-orientation:
59.7 % were targeted for being gay men, 12.2% were
targeted for being lesbian women, and 1.5% were targeted
for being bisexual. Another 24.9% targeted LGBTQ people
generally without listing a specific identity.
Of the 189
victims targeted for gender-identity, 160 were victims
of anti-transgender bias and 29 were victims of
anti-gender non-conforming (GNC) bias. This is an
increase over the 131 reported anti-transgender or anti-GNC
hate crimes in 2017.
[Source: Federal Bureau of Investigation, November 2019]
LGBTQ Nation: Anti-LGBTQ Hate Crimes Reach a New High
HRC Report: Alarming Increase in Number of LGBTQ Hate
Crimes
Mother Jones: Is Political Climate Leading to More Anti-LGBTQ
Violence?
Anti-LGBTQ Violence on the Rise and Government is to
Blame
CBS News: Data Shows US Hate Crimes Continue to Rise
Reuters: Attacks Against
LGBTQ Community Rarely Prosecuted
States With the Smallest Percentage of
LGBTQ People
Growing Acceptance of Legality of
Gay Sex
Do you think gay or lesbian relations between consenting
adults should or should not be legal?
A recent Gallup poll (September 2017) found that 72% of
Americans believe gay sex should be legal. Over the
years the numbers have been moving in the right
direction overall. Gallup began asking the question back
in 1978, when 43% of people said gay sex should be
legal. Now a full 72% of people believe gay sex
should be legal.
1978 43%
approval
1993 48%
approval
2002 54%
approval
2004 60%
approval
2011 64%
approval
2017 72% approval
The numbers are also moving in the right direction on
marriage equality, with 64 % saying same-sex marriages
“should be recognized under the law as valid, with the
same rights as traditional marriages.” That is up from
just 27% back in 1997.
The US Supreme Court struck down laws criminalizing
consensual gay sex with Lawrence v. Texas in 2003.
And the Supreme Court legalized same-sex marriage with Obergefell v. Hodges in 2015.
Census Bureau Wants LGBTQ Americans to Be Counted
Global Survey: 1 in 5 Young Adults Are Not Straight
Infographic: Why Diversity Matters in the Workplace
Research Data: LGBTQ Workplace Issues
Almost 50% of Gen Z Identifies as Not Fully Straight
New Poll: Americans Identifying as LGBTQ More Than Ever
HRC Statistics: Growing Up LGBTQ in America
Equaldex: LGBTQ Rights Across the World
Just How Many LGBTQ Americans Are There?
Gallup polling show that 4 percent of Americans are
LGBTQ. But with more millennials self-identifying as
LGBTQ, that number could one day reach the oft-cited "1
in 10."
Both of these things are probably true: You have heard
that 1 in 10 people are gay and you have no idea where
that statistic came from.
Estimates of the size of the LGBTQ population have
always been murky, bordering on mythological. The
1-in-10 figure first emerged out of post-World War II
studies by the pioneering sexologist Alfred Kinsey, who
reported that 10 percent of men were “more or less
exclusively homosexual.” That number wasn’t perfect (and
it’s been continuously revised) but it became a
politically expedient tool in the Stonewall era.
Now, over 60 years after Kinsey’s death, new Gallup data
shows that the estimated size of the US LGBTQ
population as a whole is getting closer than ever to the
legendary “1-in-10” number, among millennials, at least.
Using Gallup data taken from interviews with over 1.6
million adults, demographer Gary J. Gates reported that
10 million Americans (4 percent of the population) now
identify as LGBTQ.
That includes a record-high 7.3 percent of people born
between 1980 and 1998 who now identify as LGBTQ, up from
5.8 percent in 2012. This new data reinforces a 2015
conclusion from the Public Religion Research Institute
that “7 percent of millennials identify either as
lesbian, gay, bisexual, transgender, or queer” based on a
survey of 2,000 adults.
Infographic: Transgender Issues in the Workplace
America's LGBTQ Community: Eye-Opening Facts and Stats
New Poll: 75% of Americans
Support LGBTQ Non-Discrimination Laws
Gallup: More Americans
Than Ever Identify as LGBTQ
Workplace Diversity: Benefits of Hiring LGBTQ People
Infographic: Sexual Orientation in the Workplace
CBS News: 1 in 6 Gen Z Adults Identify as Queer
But will that number ever reach 10 percent in the
population at large?
“It’s not a completely unrealistic figure,” Gates said.
“Certainly it appears as if (given a little more time)
it might, in fact, be the case that close to 10 percent
identify as LGBTQ.”
Gates is one of the top demographers of the LGBTQ
population in the United States, and the author of a
widely-cited 2011 Williams Institute meta-analysis on
the subject, which estimated that 3.5 percent of adults
identify as lesbian, gay, or bisexual, and 0.3 percent
identify as transgender. He said that the increasing
size of the LGBTQ population estimate can largely be
attributed to “people feeling more comfortable and more
willing to identify as LGBTQ.”
But some groups are more willing than others to disclose
their identity to a Gallup interviewer. Millennials, as
Gates noted in his report, are responsible for
“virtually all of the increases observed in overall
LGBTQ self-identification,” which is unsurprising
because they are “the first generation in the US to
grow up in an environment where social acceptance of the LGBTQ community markedly increased.”
In other words, it’s not the case that LGBTQ identity is
suddenly rising in prevalence but that today’s young
people are simply more forthcoming when asked about
sexuality and gender on surveys. If you’re a baby
boomer, think of it as a variation on that quote from
the 1989 Kevin Costner classic Field of Dreams: “If you
build LGBTQ inclusion, they will come out.”
And one sub-group of the LGBTQ community seems to be
coming out (to Gallup, at least) in particularly large
numbers.
States With the
Smallest Percentage of LGBTQ
People
Nearly 1 in 5 LGBTQ Adults Have
Never Come Out, Gallup Survey
Finds
Census Estimate: One Million LGBTQ Households in America
1 in 5 Adult Members of Gen Z
Self-Identify as LGBTQ
Business Insider: Demographics of
America’s Gay Households
Williams Institute: LGBTQ Population Statistics
LGBTQ Bullying Statistics
“It’s very clear that some of the biggest increases are
among women identifying as bisexual,” Gates revealed.
“That’s what’s really driving a lot of these findings.”
Bisexual people, as Gates has previously reported,
constitute a “slight majority” of the lesbian, gay, and
bisexual community.
However, bisexual people are much less likely to be out
of the closet than their lesbian or gay peers, with only
28 percent telling Pew in 2013 that “most or all of the
important people in their lives” knew about their sexual
orientation.
Increased bisexual self-identification among women,
then, is an encouraging sign for a particularly maligned
subset of the LGBTQ community.
Bisexual men, unfortunately, are subject to unique
stereotypes and stigmas that may make it even more
difficult to measure their number. Only 12 percent of
bisexual men told Pew that they were out to the
important people in their lives.
This uneven growth in LGBTQ self-identification across
different sexual orientations and genders makes it
challenging for Gates to confidently predict how quickly
(or if) the estimated size of the LGBTQ population will
rise beyond the 7 percent rate currently found among
millennials.
“Ten years down the road, are men going to catch up or
is that gap going to get bigger?” he wondered aloud.
But one thing’s for certain: The more LGBTQ people
experience social acceptance, the more accurate our
estimates of the size of the LGBTQ population will
become.
In today’s social climate, research suggests that LGBTQ
people may still be unwilling to self-identify as such
on anonymous surveys. In one 2013 study from researchers
at Ohio State University and Boston University (reported
by Pew) the percentage of respondents who identified as
non-heterosexual on a survey nearly doubled when they
asked about sexual orientation in an indirect and even
more anonymous way.
Info: LGBTQ Research and Reports
Gallup Poll: Adults in US Identifying at LGBTQ
Daily Beast: How Many LGBTQ Americans Are There?
LGBTQ Wellness: It's All About the Data
Time Mag: How Many Americans Are Gay?
HRC Statistics: Growing Up LGBTQ in America
Gates points to discouraging indicators of contemporary
anti-LGBTQ prejudice (like the fact that close to 30
percent of Americans think that same-sex sexual behavior
should be illegal) as a sign that “we’re still quite a
bit away” from being confident that all survey
respondents are comfortable disclosing their sexual and
gender identity.
Demographers can make estimates and the government can
try to ask about LGBTQ identity on the census, but until
being LGBTQ is a total non-issue, we’ll never know the
size of the population for sure.
Gates stresses that it’s still no cake walk for young
people to come out, a response to the myths that it’s now
“trendy” to be LGBTQ and that children are being “peer
pressured” into being gay.
“I can still offer you so many examples of why it is so
difficult to be out as an LGBTQ person today,” he said.
“So the idea that it’s somehow just easy for any
generation (particularly younger generations to come
out) seems to me just ridiculous on the face of it.”
But generational change will almost certainly make
coming out easier for everyone, young and old alike. And
that’s why, if pressed, Gates does expect the estimated
size of the LGBTQ population to climb ever closer to the
mythical “one-in-10” mark.
“Based on research, I think the answer is probably that,
in fact, these numbers are just going to get closer and
closer (and maybe exceed) 10 percent down the road,” he
said.
[Source: Samatha Allen, Daily Beast, January 2017]
Business Insider: Demographics of
America’s Gay Households
Williams Institute: LGBTQ Population Statistics
LGBTQ Bullying Statistics
Info: LGBTQ Research and Reports
Almost 50% of Gen Z Identifies as Not Fully Straight
America's LGBTQ Community: Eye-Opening Facts and Stats
Gallup Poll: Adults in US Identifying at LGBTQ
LGBTQ People in the US: Select Findings from the
Generations and TransPop Studies
Daily Beast: How Many LGBTQ Americans Are There?
LGBTQ Wellness: It's All About the Data
Time Mag: How Many Americans Are Gay?
Results of Gallup Poll on LGBTQ Population
About 10 million Americans (or 4.6 percent of the US
population) identified as LGBTQ in 2016.
A new Gallup poll released the findings, which show a
rise in 1.75 million people since 2012. To determine
these numbers, pollsters conducted interviews with
random sample of 1.6 million US adults (over age 18)
for the past five years, asking, "Do you, personally,
identify as lesbian, gay, bisexual or transgender?"
Nearly 50,000 responded in the affirmative.
The report claimed self-identification is only one way
to measure the nation's LGBTQ population. It noted how
"direct assessments of same-sex sexual behavior or
attraction yield very different (and often larger)
population estimates."

Here are some of the other significant findings. Young
people born between 1980-1998 were twice as likely as
other age demographics to identify as LGBTQ. Although
they account for only 32 percent of the adult
population, millennials comprised 58 percent of the
total number of self-identified LGBTQ Americans. Gallup
attributes this to a decline in stigma.
"It's likely that millennials are the first
generation in the US to grow up in an environment where social
acceptance of the LGBTQ community markedly increased,"
the report noted. "This may be an important factor in
explaining their greater willingness to identify as
LGBTQ."
"They may not have experienced the levels of
discrimination and stigma experienced by their older
counterparts," it added. "The perceived risks associated
with publicly identifying as LGBTQ might also be lower
in millennials than among other generations."

In addition, women (4.4 percent) were more likely than
men (3.7 percent) to identify as LGBTQ. The former group
also accounted for a greater increase since 2012.
In terms of race and ethnicity, polled demographics were
white (3.6 percent), black (4.6 percent), Hispanic (5.4
percent), Asian (4.9 percent), and other (6.3 percent).
Asian-Americans, which tallied 3.5 percent in 2012, saw
the largest increase in numbers. According to Gallup,
this means that 40 percent of self-identified LGBTQ
adults are people of color, an increase from 33 percent
in 2012.
Gallup measured other factors. For example, LGBTQ adults
in the survey were more likely be non-religious (56
percent) than straight people (32 percent). The poll
also examined education attainment and annual household
income.
"In a span of only five years, the demographic
composition of Americans who identify as LGBTQ has
markedly changed," the report stated. "It has become
larger, younger, more female and less religious. These
demographic traits are of interest to a wide range of
constituencies."
[Source: Advocate Magazine]
MAP: State by State LGBTQ Population Statistics
Equaldex: LGBTQ
Rights Across the World
Advocate Mag: Record Number of Americans Identify as
LGBTQ
Gallup Poll: Same Sex Marriages
Nearly 1 in 5 LGBTQ Adults Have
Never Come Out, Gallup Survey
Finds
Still I Rise: A Look at the LGBTQ Struggle Through
Statistics
Info: LGBTQ Research and Reports
GLSEN: National LGBTQ Research and Reports
America's LGBTQ Community: Eye-Opening Facts and Stats
Nielson: LGBTQ Consumer Report
States With the Smallest Percentage of
LGBTQ People
LGBTQ Statistics
--42% of people who are LGBTQ report living in an
unwelcoming environment.
--80% of gay and lesbian youth report severe social
isolation.
--6 in 10 LGBTQ students report feeling unsafe at school
because of their sexual orientation.
--90% of teens who are LGBTQ come out to their close
friends.
--In 2013, 92% of adults who are LGBTQ said they believe
society had become more accepting of them than in the
past 10 years.
--42% of people who are LGBTQ report living in an
unwelcoming environment.
--80% of gay and lesbian youth report severe social
isolation.
--6 in 10 LGBTQ students report feeling unsafe at school
because of their sexual orientation. You can encourage
your classmates to accept LGBTQ students by promoting
your views on social media.
--90% of teens who are LGBTQ come out to their close
friends.
--In 2013, 92% of adults who are LGBTQ said they believe
society had become more accepting of them than in the
past 10 years.
Nielson: State of the LGBTQ Consumer
Census Bureau Wants LGBTQ Americans to Be Counted
Global Survey: 1 in 5 Young Adults Are Not Straight
Infographic: Why Diversity Matters in the Workplace
CBS News: 1 in 6 Gen Z Adults Identify as Queer
Research Data: LGBTQ Workplace Issues
US Health & Human Services Reports: LGBTQ Health and
Wellbeing
Pew Research Center: Survey of LGBTQ Americans
New Poll: Americans Identifying as LGBTQ More Than Ever

GLSEN Report: LGBTQ Youth Statistics
--Over 90% of LGBTQ youth report that they sometimes or
frequently hear homophobic remarks in their school
(words such as "faggot", "dyke", or "queer").
--36% of lesbian, gay and bisexual youth report hearing
homophobic remarks from faculty or school staff.
--20% of secondary school counselors report that
counseling a homosexual student concerning gay issues
would not be personally gratifying, and do not consider
themselves competent in counseling gay adolescents.
--LGBTQ youth are almost twice as likely as their
non-gay peers to be threatened with or injured by a
weapon at school.
--LGBTQ youth are more than four times as likely to skip
whole days of school out of fear.
--Harassed youth are more than four times as likely to
report having made a serious enough suicide attempt to
have been treated by a doctor or nurse.
[Source: Gay, Lesbian, and Straight Education Network,
GLSEN]
HRC Statistics: Growing Up LGBTQ in America
Infographic: Transgender Issues in the Workplace
America's LGBTQ Community: Eye-Opening Facts and Stats
Gallup Poll: Adults in US Identifying at LGBTQ
MAP: State by State LGBTQ Population Statistics
New Poll: 75% of Americans
Support LGBTQ Non-Discrimination Laws
Gallup: More Americans
Than Ever Identify as LGBTQ
Workplace Diversity: Benefits of Hiring LGBTQ People
Infographic: Sexual Orientation in the Workplace
Businesses and Government Officials Should Not
Discriminate Against LGBTQ People
According to The Harris Poll, the majority of Americans
agree that businesses and government officials should
not discriminate against LGBTQ people.
As Kentucky’s Rowan County Clerk Kim Davis may now
realize, most Americans believe that government
officials should not allow their religious beliefs to
stand in the way of issuing marriage licenses to all
couples. A new national survey reveals that Americans
shun this form of discrimination not only by public
officials, but also by businesses that wish to deny
goods or services to lesbian, gay, bisexual,
transgender, or queer (LGBTQ) people.
A full two-thirds (67%) of Americans, including 78% of
LGBTQ Americans, agreed that a government official
should be obligated to serve all of the public and
perform all duties, regardless of their religious
beliefs. The Out & Equal Workplace survey also confirmed
that 60% of Americans (and 80% of LGBTQ individuals)
believe that business owners should not be permitted to
turn away anyone based on their religious beliefs.
These and other findings were included in the 2015 Out &
Equal Workplace Survey, released today. The annual study
was conducted online between September 9 and 17, 2015,
by The Harris Poll in conjunction with Out & Equal
Workplace Advocates and Witeck Communications, among
2,368 US adults, of whom 304 self-identified as
lesbian, gay, bisexual and/or transgender (which
includes an over-sample of gay and lesbian adults).
Launched in 2002, this survey has become a trusted
annual barometer of attitudes surrounding LGBTQ issues
in the workplace and is the longest-running national
survey of its kind. Full results of this study,
including data tables, can be found here.
“These findings makes it clear that a majority of
Americans still believe that fairness and equal
treatment are a birthright for all of us, and that
discrimination against LGBTQ people has no
justification,” said Selisse Berry, Founder, CEO, Out &
Equal Workplace Advocates. “This past year, we saw more
and more business leaders and corporations boldly oppose
discriminatory religious freedom legislation, while
standing up for their workforce and their customers. Out
& Equal takes pride in helping build this positive
foundation for equality across America and around the
world.”
Strong Support for Federal Non-Discrimination
Protections:
The survey also informed respondents that there is no
federal law today that protects someone who is gay or
transgender from discrimination in public accommodations
such as restaurants, hotels and other businesses open to
all the public. When asked if they would support such a
law, 6 out of 10 (62%) Americans agreed, with 44% saying
they “strongly support” a federal law, and, by contrast,
only 14% saying they “strongly oppose” such a law.
In a related question, the survey found that 21% of
Americans believe that LGBTQ people are protected from
being fired because of their sexual orientation or
gender identity in all 50 states, including 12% of LGBTQ
people who share this misconception. However, there is
no such federal law, and today there are only 22 states
with workplace protections based on sexual orientation,
and 19 states that include protections for gender
identity.
State Exemptions for Individual Religious Beliefs:
The survey also touched on the rise of state legislation
that would expand ways to exempt individuals from laws
or regulations that conflict with their religious
beliefs. Forty-five percent of Americans say they oppose
expanding these religious exemptions at the state level,
with just 30% in support. Roughly one out of five,
however, said they still were not sure.
“Americans are debating and learning much about the kind
of society they desire,” said Bob Witeck, President of
Witeck Communications. “The good news is that their
distaste for discrimination seems to be growing, and
this signal is keenly understood in the marketplace and
throughout American life.”
Methodology:
This Harris Poll was conducted online (in partnership
with Out & Equal and Witeck Communications) within the
United States between September 9 and 17, 2015, among
2,368 adults (ages 18 and over), of whom 304
self-identified as gay, lesbian, bisexual, transgender,
and queer (including an over-sample of lesbian and gay
adults). Figures for age, sex, race, education, region
and income were weighted where necessary to bring them
into line with their actual proportions in the
population. In addition, the results for the gay and
lesbian sample were weighted separately based on
profiles of the gay and lesbian population that The
Harris Poll has compiled through many different online
surveys. Propensity score weighting also was used to
adjust for respondents’ propensity to be online.
All sample surveys and polls, whether or not they use
probability sampling, are subject to multiple sources of
error which are most often not possible to quantify or
estimate, including sampling error, coverage error,
error associated with non-response, error associated
with question wording and response options, and
post-survey weighting and adjustments. Therefore, The
Harris Poll avoids the words “margin of error” as they
are misleading. All that can be calculated are different
possible sampling errors with different probabilities
for pure, unweighted, random samples with 100% response
rates. These are only theoretical because no published
polls come close to this ideal.
Respondents for this survey were selected from among
those who have agreed to participate in Harris Poll
surveys. The data have been weighted to reflect the
composition of the adult population. Because the sample
is based on those who agreed to participate in the
Harris Poll, no estimates of theoretical sampling error
can be calculated.
These statements conform to the principles of disclosure
of the National Council on Public Polls.
[Source: The Harris Poll, October 2015]
Experiences with Violence
According to data from the 2015 national Youth Risk
Behavior Survey (YRBS), of surveyed LGB students:
--10% were threatened or injured with a weapon on school
property
--34% were bullied on school property
--28% were bullied electronically
--23% of LGB students who had dated or went out with
someone during the 12 months before the survey had
experienced sexual dating violence in the prior year
--18% of LGB students had experienced physical dating
violence
--18% of LGB students had been forced to have sexual
intercourse at some point in their lives.3
MAP: State by State LGBTQ Population Statistics
Advocate Mag: Record Number of Americans Identify as
LGBTQ
Still I Rise: A Look at the LGBTQ Struggle Through
Statistics
America's LGBTQ Community: Eye-Opening Facts and Stats
LGBTQ Wellness: It's All About the Data
GLSEN: National LGBTQ Research and Reports
Nielson: LGBTQ Consumer Report

Survey of LGBTQ Americans
An overwhelming share of America’s lesbian, gay,
bisexual, transgender, and queer adults (92%) say
society has become more accepting of them in the past
decade and an equal number expect it to grow even more
accepting in the decade ahead. They attribute the
changes to a variety of factors, from people knowing and
interacting with someone who is LGBTQ, to advocacy on
their behalf by high-profile public figures, to LGBTQ
adults raising families.
At the same time, however, a new nationally
representative survey of 1,197 LGBTQ adults offers
testimony to the many ways they feel they have been
stigmatized by society. About four-in-ten (39%) say that
at some point in their lives they were rejected by a
family member or close friend because of their sexual
orientation or gender identity. 30% say they have been
physically attacked or threatened. 29% say they have
been made to feel unwelcome in a place of worship.
And
21% say they have been treated unfairly by an employer.
About six-in-ten (58%) say they’ve been the target of
slurs or jokes.
Also, just 56% say they have told their mother about
their sexual orientation or gender identity, and 39%
have told their father. Most who did tell a parent say
that it was difficult, but relatively few say that it
damaged their relationship.
The survey finds that 12 is the median age at which
lesbian, gay and bisexual adults first felt they might
be something other than heterosexual or straight. For
those who say they now know for sure that they are
lesbian, gay, bisexual, transgender, or queer, that
realization came at a median age of 17.
[Source: Pew Research Center]
Nielson: State of the LGBTQ Consumer
US Health & Human Services Reports: LGBTQ Health and
Wellbeing
Pew Research Center: Survey of LGBTQ Americans
Info: LGBTQ Research and Reports
Gallup Poll: Adults in US Identifying at LGBTQ
MAP: State by State LGBTQ Population Statistics
LGBTQ People in the US: Select Findings from the
Generations and TransPop Studies

LGBTQ Population Surveys
According to the Williams Institute at the UCLA Law
School, increasing numbers of population-based surveys
in the United States and across the world include
questions that allow for an estimate of the size of the
lesbian, gay, bisexual, transgender, and queer (LGBTQ)
population. This research brief discusses challenges
associated with collecting better information about the
LGBTQ community and reviews eleven recent US and
international surveys that ask sexual orientation or
gender identity questions. The brief concludes with
estimates of the size of the LGBTQ population in the
United States.
Key findings from the research brief are as follows: An
estimated 3.5% of adults in the United States identify
as lesbian, gay, or bisexual and an estimated 0.3% of
adults are transgender. This implies that there are
approximately 9 million LGBTQ Americans, a figure
roughly equivalent to the population of New Jersey.
Among adults who identify as LGB, bisexuals comprise a
slight majority (1.8% compared to 1.7% who identify as
lesbian or gay). Women are substantially more likely
than men to identify as bisexual. Bisexuals comprise
more than half of the lesbian and bisexual population
among women in eight of the nine surveys considered in
the brief. Conversely, gay men comprise substantially
more than half of gay and bisexual men in seven of the
nine surveys. Estimates of those who report any lifetime
same-sex sexual behavior and any same-sex sexual
attraction are substantially higher than estimates of
those who identify as LGB. An estimated 19 million
Americans (8.2%) report that they have engaged in
same-sex sexual behavior and nearly 25.6 million
Americans (11%) acknowledge at least some same-sex
sexual attraction. Understanding the size of the LGBTQ
population is a critical first step to informing a host
of public policy and research topics. The surveys
highlighted in this report demonstrate the viability of
sexual orientation and gender identity questions on
large national population-based surveys. Adding these
questions to more national, state, and local data
sources is critical to developing research that enables
a better understanding of the understudied LGBTQ
community.
HRC Statistics: Growing Up LGBTQ in America
PBS: LGBTQ America By The Numbers
CDC: LGBTQ Health Statistics
Pew Research Center: Survey of LGBTQ Americans
Wikipedia: LGBTQ Demographics in the US
LGBTQ Wellness: It's All About the Data
Equaldex: LGBTQ Rights Across the World
Americans Identifying as LGBTQ
--10 million (4.1%)
American adults identify as LGBTQ
--LGBTQ millennials up
from 5.8% in 2012 to 7.3% in 2016
--LGBTQ identification
higher among women
The portion of American
adults identifying as lesbian, gay, bisexual,
transgender, or queer (LGBTQ) increased to 4.1% in 2016
from 3.5% in 2012. These figures, drawn from the largest
representative sample of LGBTQ Americans collected in
the US, imply that more than an estimated 10 million
adults now identify as LGBTQ in the US today,
approximately 1.75 million more compared with 2012.
This
analysis is based on interviews with a random sample of
more than 1.6 million US adults as part of Gallup Daily
tracking. Across the five years of data collection, more
than 49,000 respondents said "yes" when asked, "Do you,
personally, identify as lesbian, gay, bisexual,
transgender, or queer?"
Millennials, defined here as those born between 1980 and
1998, drive virtually all of the increases observed in
overall LGBTQ self-identification. The portion of that
generation identifying as LGBTQ increased from 5.8% in
2012 to 7.3% in 2016. LGBTQ identification remained
relatively stable over the five-year period at 3.2%
among Generation X and declined slightly from 2.7% to
2.4% among baby boomers and from 1.8% to 1.4% among
traditionalists.
Millennials are more than twice as likely as any other
generation to identify as LGBTQ. In 2012, they accounted
for 43% of LGBTQ-identified adults. As a result of their
disproportionate increases in identification since then,
they now account for 58%. Millennials comprise 32% of
the general adult population.
LGBTQ
identification increases are more pronounced in women
than in men. In 2012, 3.5% of women identified as LGBTQ,
comparable to the 3.4% of men. By 2016, LGBTQ
identification in women increased to 4.4% compared with
3.7% among men. These changes mean that the portion of
women among LGBTQ-identified adults rose slightly from
52% to 55%.
Among
racial and ethnic minorities, the largest increases
since 2012 in LGBTQ identification occurred among Asians
(3.5% to 4.9%) and Hispanics (4.3% to 5.4%). Among
whites, the comparable figures are 3.2% to 3.6%. Black
Americans showed only a slight increase from 4.4% to
4.6%, and among "other" racial and ethnic groups, the
increase was from 6.0% to 6.3%.
The
relatively larger increases in LGBTQ identification
among racial and ethnic groups other than white,
non-Hispanics mean that these racial and ethnic
minorities now account for 40% of LGBTQ-identified
adults compared with 33% in 2012. In the general
population, 33% of adults identify their race or
ethnicity as other than white, non-Hispanic, an increase
from 28% in 2012.
The
variations in increases in LGBTQ identification by race
and ethnicity are likely affected by differences in the
age composition of the groups. According to the Gallup
data, the average age of Asian adults in the US is 35,
the youngest among the race/ethnicity groupings. Average
age is 39 among Hispanics, 44 among blacks, 51 among
white adults, and 44 among "other" racial and ethnic
groups. Given the big changes in LGBTQ identification
among millennials, the youngest generation, it's not
surprising that younger racial and ethnic groups report
larger LGBTQ identification increases.
[Source:
Gallup Poll]
NBC: 1 in 5 Adult Members of Gen Z
Self-Identify as LGBTQ
HRC Statistics: Growing Up LGBTQ in America
PBS: LGBTQ America By The Numbers
America's LGBTQ Community: Eye-Opening Facts and Stats
CDC: LGBTQ Health Statistics
LGBTQ People in the US: Select Findings from the
Generations and TransPop Studies
Pew Research Center: Survey of LGBTQ Americans
Wikipedia: LGBTQ Demographics in the US
Daily Beast: Just How Many LGBTQ
Americans Are There?
Same-Sex Marriages
Same-sex marriages are on
the rise. Surveys conducted by Gallup over the past year
find that about one-in-ten LGBTQ Americans (10.2%) are
married to a same-sex partner, up from the months before
the high court decision (7.9%). As a result, a majority
(61%) of same-sex cohabiting couples are now married, up
from 38% before the ruling.
Just like
the general public, Americans who identify as lesbian,
gay, bisexual, transgender, or queer (LGBTQ) are most
likely to cite love as a very important reason for
getting married. In a 2013 Pew Research Center survey,
84% of LGBTQ adults and 88% of the general public cited
love as a very important reason for getting married, and
at least seven-in-ten in both groups cited companionship
(71% and 76%, respectively). But there were some
differences, too. LGBTQ Americans, for instance, were
twice as likely as those in the general public to cite
legal rights and benefits as a very important reason for
getting married (46% versus 23%), while those in the
general public were nearly twice as likely as LGBTQ
Americans to cite having children (49% versus 28%).
[Source:
Pew Research Center]
HRC Statistics: Growing Up LGBTQ in America
PBS: LGBTQ America By The Numbers
America's LGBTQ Community: Eye-Opening Facts and Stats
CDC: LGBTQ Health Statistics
Pew Research Center: Survey of LGBTQ Americans
Wikipedia: LGBTQ Demographics in the US
LGBTQ Wellness: It's All About the Data
Daily Beast: Just How Many LGBTQ
Americans Are There?
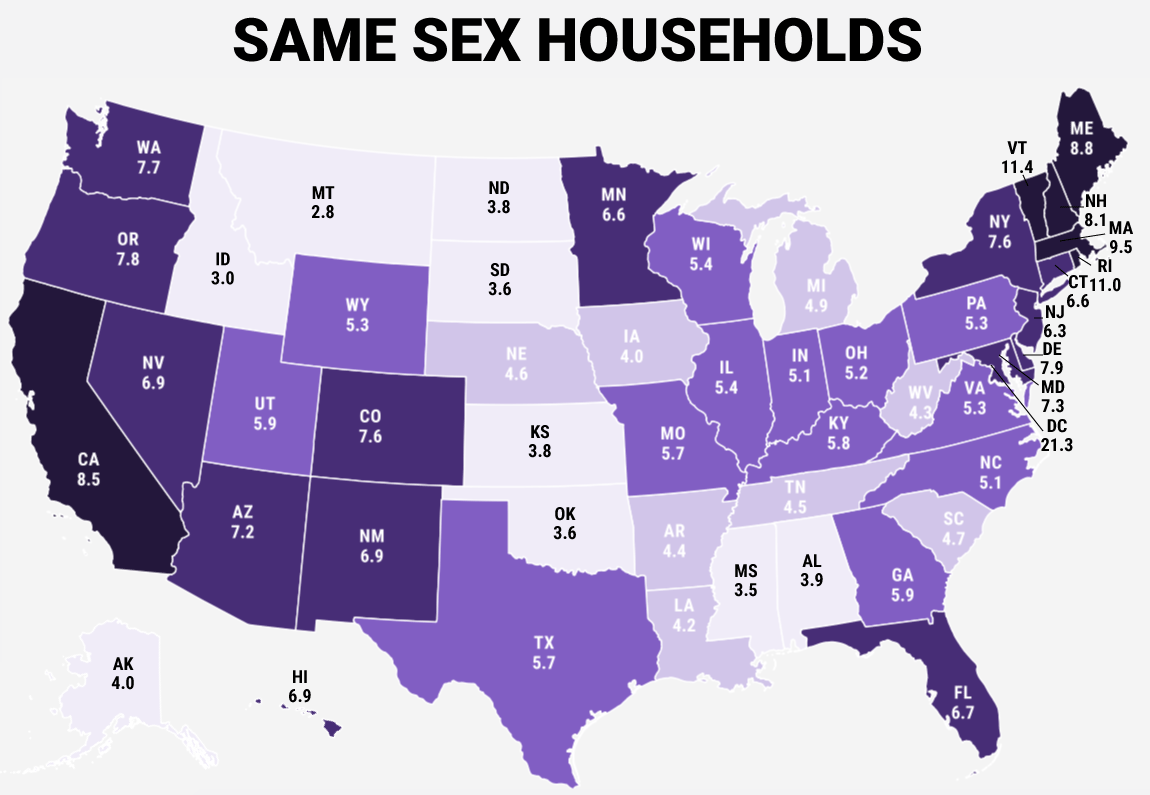
LGBTQ Household Demographics
The Census
Bureau's American Community Survey is a giant annual
survey that asks millions of Americans each year several
questions about demographics, economic issues, and
social status. When summarizing the results from the
2013 survey, the Census Bureau released statistics
focusing on same sex couples living together.
Same sex
households tend to be more concentrated in the West,
Southwest, and Northeast. Washington, DC had the highest
rate of same sex households, with 21.3 out of every
1,000 households being headed by a same sex couple.
Same-Sex
Households per 1,000 households:
|
DC 21.3
VT 11.4
RI 11.1
MA 9.5
ME 8.8
CA 8.5
NH 8.1
DE 7.9
OR 7.8
WA 7.7
NY 7.6
CO 7.6
MD 7.3
AZ 7.2
HA 6.9
NV 6.9
NM 6.9 |
FL 6.7
MN 6.6
CT 6.6
NJ 6.3
UT 5.9
GA 5.9
KY 5.8
MO 5.7
TX 5.7
WI 5.4
IL 5.4
PA 5.3
VA 5.3
WY 5.3
OH 5.2
IN 5.1
NC 5.1 |
MI 4.9
SC 4.7
NE 4.6
TN 4.5
AR 4.4
WV 4.3
LA 4.2
IA 4.0
AK 4.0
AL 3.9
ND 3.8
KS 3.8
SD 3.6
OK 3.6
MS 3.5
ID 3.0
MT 2.8 |
Both
opposite and same sex married couples tend to be older
than unmarried couples. About a quarter of all married
gay couples have the householder (the person responding
to the US Census Bureau's survey) over the age of 65.
Same sex
couples are more likely to have college degrees than
opposite sex couples. Interestingly, while married
opposite sex couples are more likely than unmarried
couples to have bachelor's degrees, the opposite is the
case for gay couples.
Gay
couples also have higher incomes than straight couples.
Married gay couples, with an average household income of
about $115,000, make slightly more money than unmarried
gay couples, whose average is $111,223. For straight
couples, the gap between married and unmarried couples
is much higher. Married straight couples make $101,487
per year on average, compared to just $69,511 for
unmarried straight couples.
[Source:
US Census Bureau]
MAP: State by State LGBTQ Population Statistics
HRC Statistics: Growing Up LGBTQ in America
Advocate Mag: Record Number of Americans Identify as
LGBTQ
Gallup Poll: Same Sex Marriages
Info: LGBTQ Research and Reports
Still I Rise: A Look at the LGBTQ Struggle Through
Statistics
GLSEN: National LGBTQ Research and Reports
Nielson: LGBTQ Consumer Report
LGBTQ Students and Cyber Bullying
Cyber bullying of LGBTQ youth is three times higher than
other student’s experience.
According to statistics from a survey conducted by GLSEN,
LGBTQ youth suffer from cyber bullying:
--42 per cent of LGBTQ youth have experienced cyber
bullying
--25 per cent more than once
--35 per cent receive online threats
--58 per cent say something bad is said to them or about
them online
--33 per cent report sexual harassment online, which is
four times higher than the experience of other students.
--27 per cent of LGBTQ youth do not feel safe online.
--20 per cent report receiving harassing text messages
from other students.
LGBTQ National Statistics: School Climate Survey
--84% of LGBTQ students reported being verbally harassed
(name calling, threats) because of their sexual
orientation.
--82.9% reported that faculty or staff never intervened
or intervened only some of the time when present when
homophobic remarks were made.
--39.1% of LGBTQ students reported being physically
harassed (being shoved, pushed) because of their sexual
orientation.
--44.7% of LGBTQ youth of color report being verbally
harassed because of both their sexual orientation and
race/ethnicity.
--LGBTQ students unable to locate supportive teachers or
staff were more than twice as likely not to plan to
continue their education after secondary school.
--Grade point average for LGBTQ students who cannot
locate any supportive faculty or staff was lower than
LGBTQ students who could locate one or more supportive
school personnel (2.8 versus 3.1).
[Source: National School Climate Survey, Gay, Lesbian &
Straight Education Network, GLSEN, 2003]
Williams Institute: LGBTQ Population Statistics
LGBTQ Bullying Statistics
Gallup Poll: Adults in US Identifying at LGBTQ
Census Bureau Wants LGBTQ Americans to Be Counted
Global Survey: 1 in 5 Young Adults Are Not Straight
Daily Beast: How Many LGBTQ Americans Are There?
LGBTQ People in the US: Select Findings from the
Generations and TransPop Studies
LGBTQ Wellness: It's All About the Data
New Poll: Americans Identifying as LGBTQ More Than Ever
HRC Statistics: Growing Up LGBTQ in America
Time Mag: How Many Americans Are Gay?
Pew Research Center: Key
Findings About LGBTQ Americans
New Poll: 75% of Americans
Support LGBTQ Non-Discrimination Laws
Gallup: More Americans
Than Ever Identify as LGBTQ
CBS News: 1 in 6 Gen Z Adults Identify as Queer

HOME
QUEER CAFE
│ LGBTQ Information Network │ Established 2017
|